Social Network and Time Series Analysis for Predicting Epidemics
The Big Picture
The task was to find quantifiable Early Warning Signals (EWS) that can indicate when epidemics of infectious disease are approaching. We modelled the hypothetical infectious disease on measles (a high-reproduction-number infectious pediatric disease) and left the vaccination decision up to the parent in the simulation.Parents generally talk to each other (in-person and online) and try to keep their children healthy. So, if we assume that parents give each other tips, then an interesting question arises: Given that the parents' social communication is strongly tied to the children's illness,
Can we listen to the parents' vaccine-related chatter to guess when a disease outbreak is coming?
We parametrised and coded a computational agent-based model in C++ (object-oriented programming, serial farming). The building blocks of the model are below.
What's An Epidemic?
A lot of people contracting an illness in a short period of time.Honestly, I've read many epidemiology studies and I've seen the word epidemic defined by the authors less than maybe 5 times. I'm not the only one pressed about it..
For a more in-depth discussion, I refer you to Sec 1.2 of my thesis; my definition is in there. Compelling read, if I might say so myself.
The Model
Parents
We modelled a social network of parents that communicate and
- adopt a stance on vaccination (either pro-, anti- or hesitant),
- talk to each of their friends once a week,
- share pro- or anti-vaccine information/propaganda with each other, such that
- each parent is peer-pressured either into or out of vaccinating their child by
- their personal network of closest friends,
- their personal beliefs and morals,
- fear of their child(ren) becoming ill (based on the number of the child's friends who are sick).
- Each parent has a single child in the school, and
- they can change their mind re: vaccination whenever they want to.
Children
Each child (of the parents mentioned previously) has a group of friends (differently sized groups; some children are popular, the others play DnD at lunchtime). Each week, each child plays with all their friends and can become infected by any other them (just like any other bug; the cold, flu, lice, etc).
When a child is infected,
- they immediately become infectious to every other child they play with while they're sick,
- the illness isn't debilitating, so parents still let them interact with their friends,
- they recover fully after two weeks, and are no longer infectious,
- they're immune to the disease for the rest of their lives,
- there are no lasting effects of the illness, so they're perfectly fine when it's over,
- if they're vaccinated, they are 100% protected against the disease for the rest of their lives,
- there is a small chance that they might die.
Vaccine
We made some simplifying assumptions about the vaccine, such as
- as soon as parents become pro-vaccine, their children are immediately vaccinated and protected
- vaccination only occurs once throughout the child's lifetime,
- it's only one shot (so, no vaccination schedule),
- it's 100% effective,
- it's immediately available (no waiting).
- it's 100% safe (so, no vaccine-related illness/death).
The Flow
Preamble
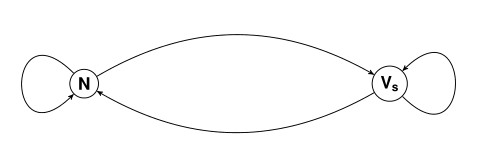
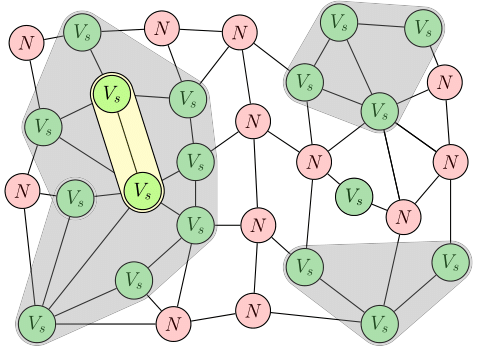
Parents can either be
- pro-vaccine Vs (V for vaccinator, s for social), or
- anti-vaccine N (N for "not a vaxxer"), or
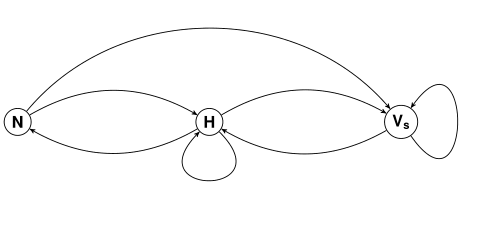
- hesitant H (introduced in the second model).
- susceptible to infection S,
- infected/infectious I.
- recovered R,
- vaccinated Vp (V for vaccinated, p for physically).
There are two variants of the model:
-
V1 - parents are either pro- or anti-vaccination, no in-between,
-
V3 - parents can either be pro-/anti-vaccine or hesitant.
- No, there's no V2. It's not a mistake.
(V1) Pro-/Anti-vaxx Dynamics and Infection
This is a picture of the path that every (child, parent) goes through in our model.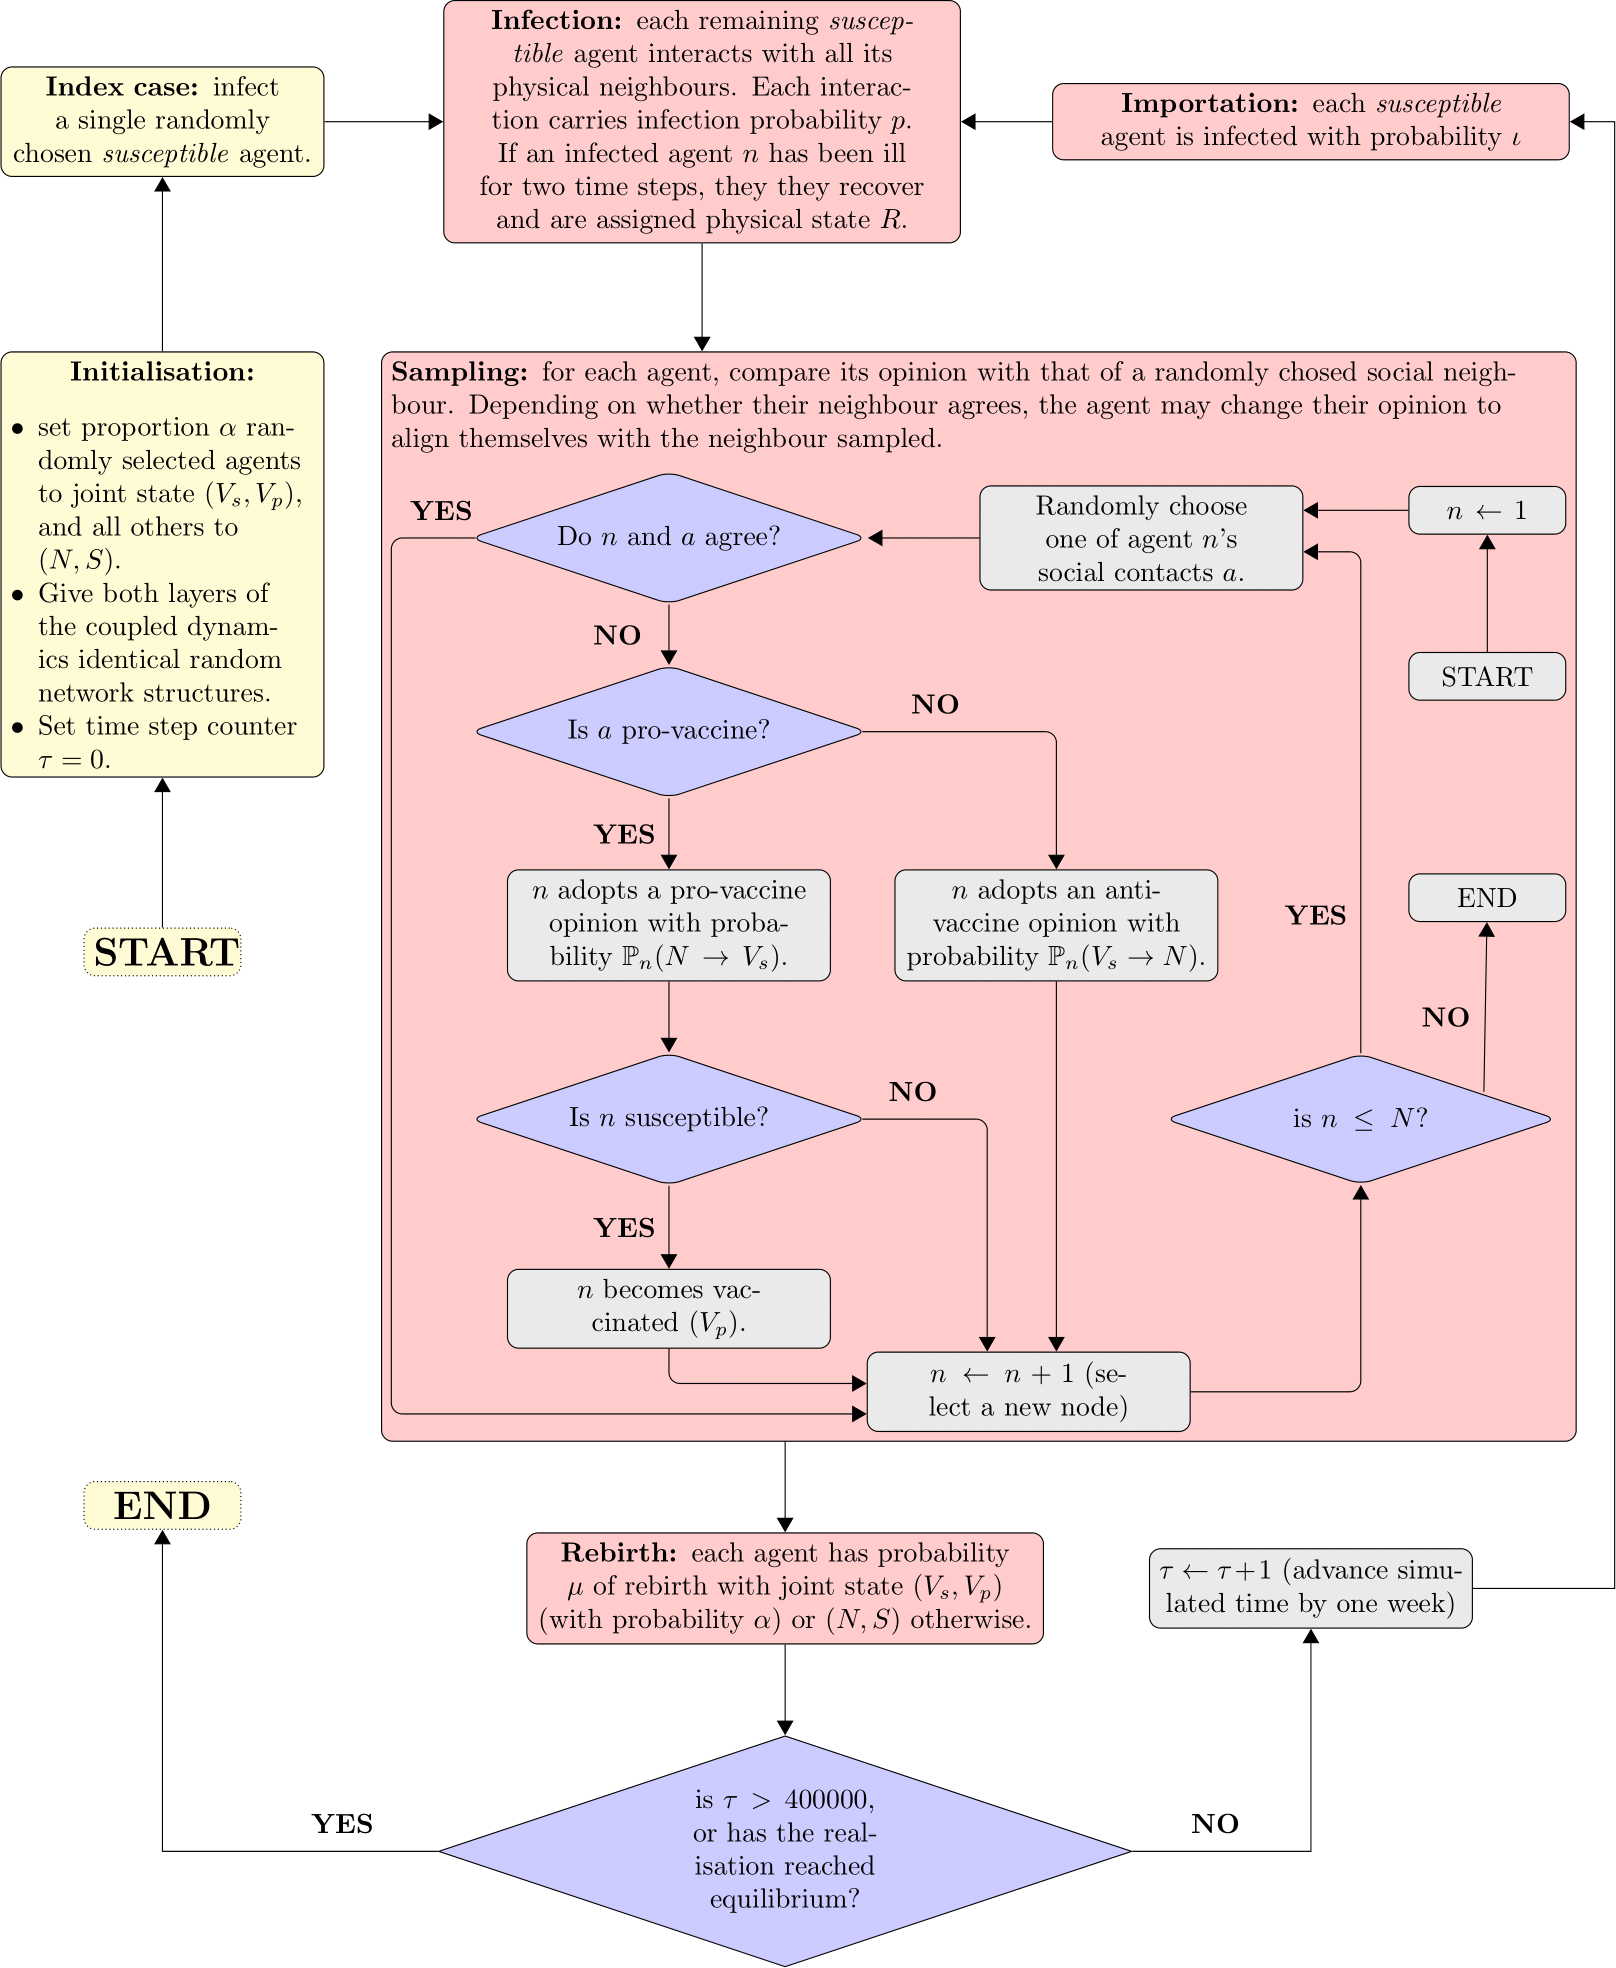
(V3) Pro-/Anti-vaxx Dynamics with Hesitance
To see what effect vaccine hesitance has, we added that state to the list of vaccine stances; here, hesitant parents simply take in information, and cannot pressure their friends into taking their opinion (because they have none).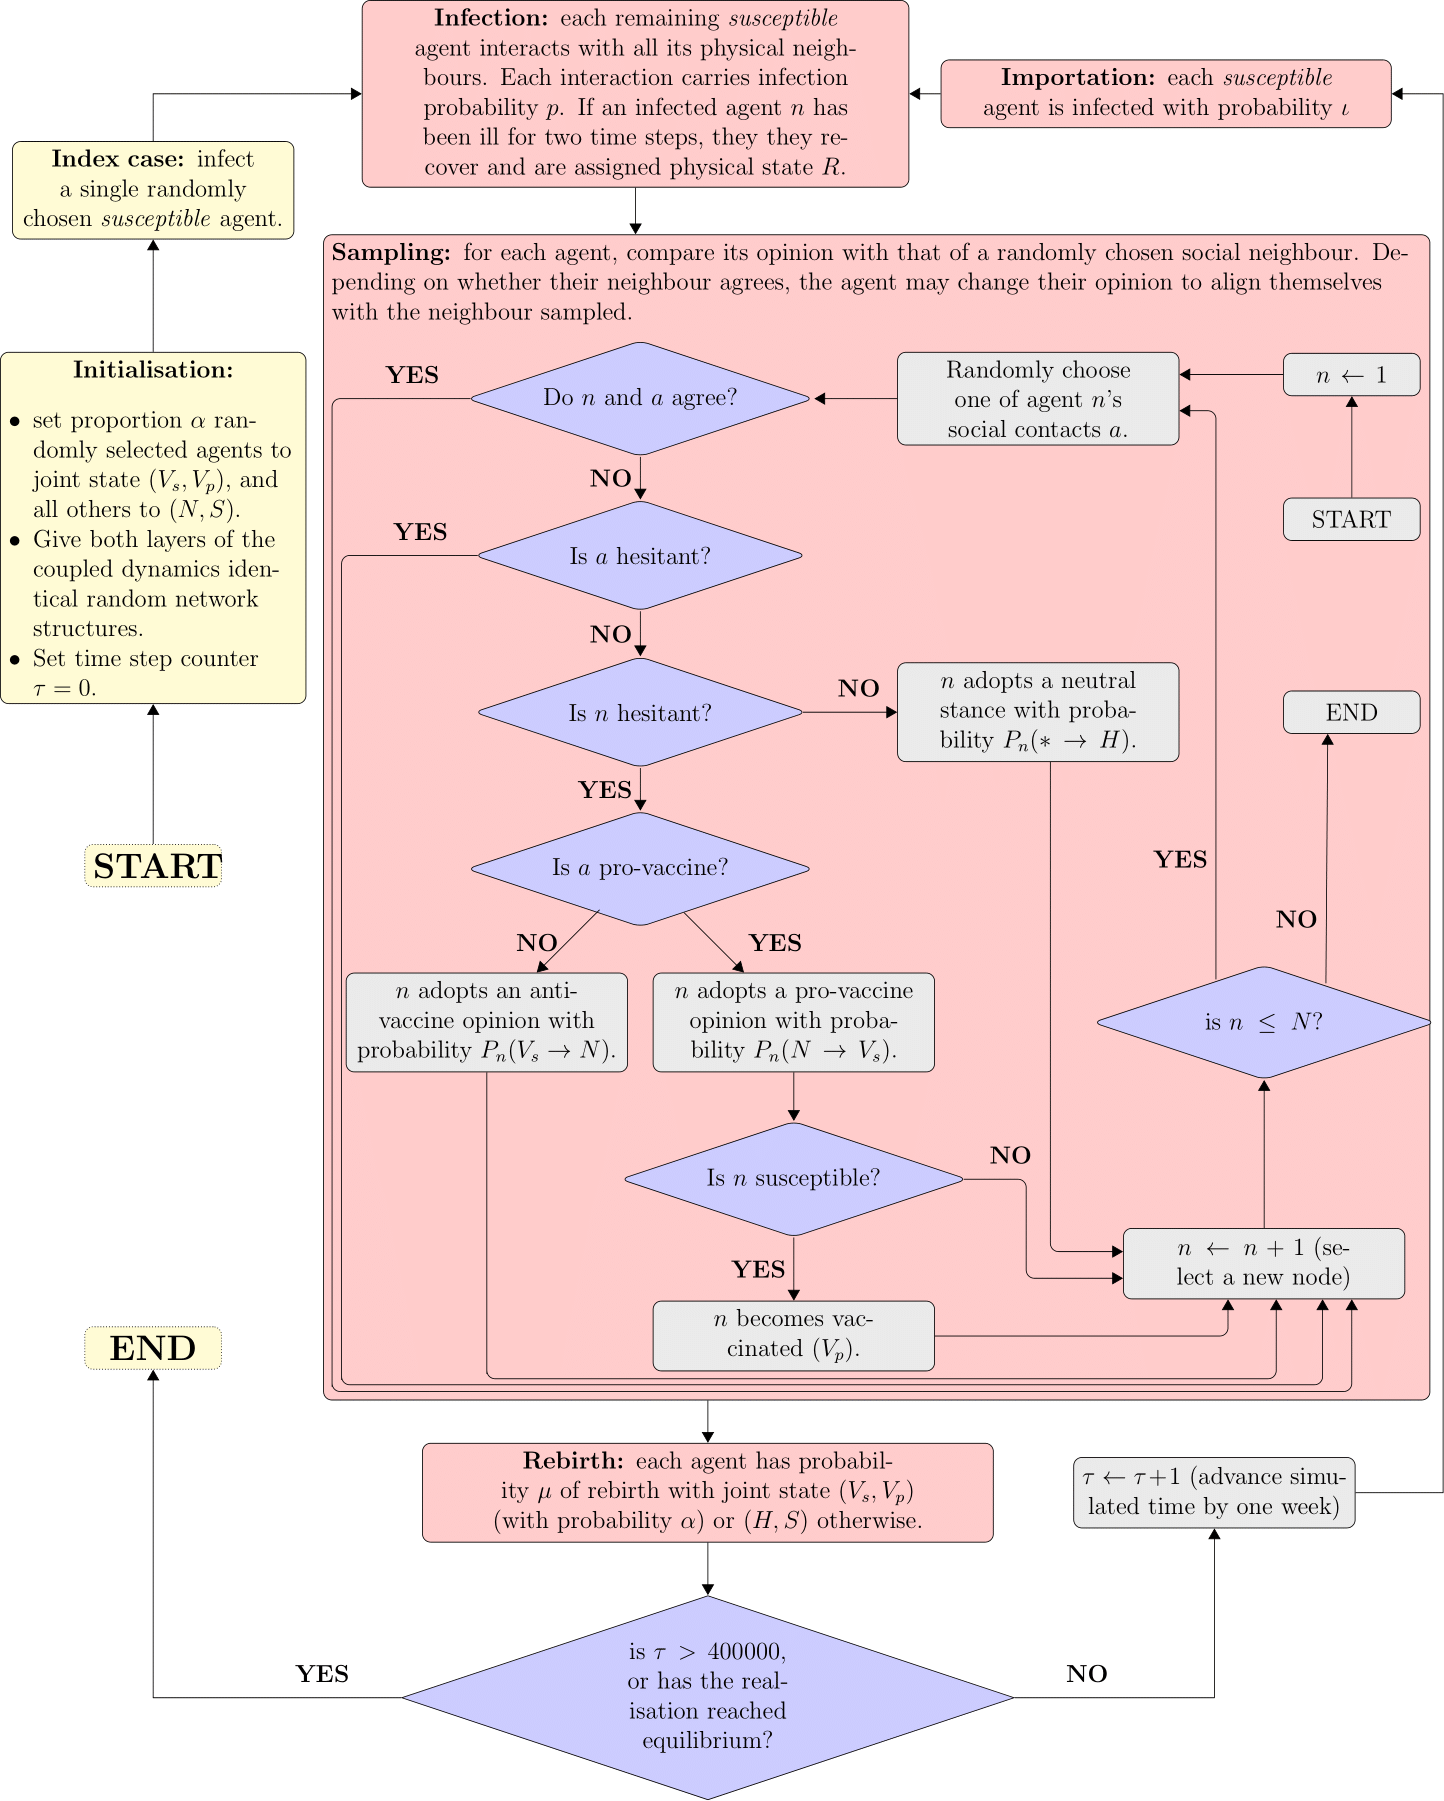
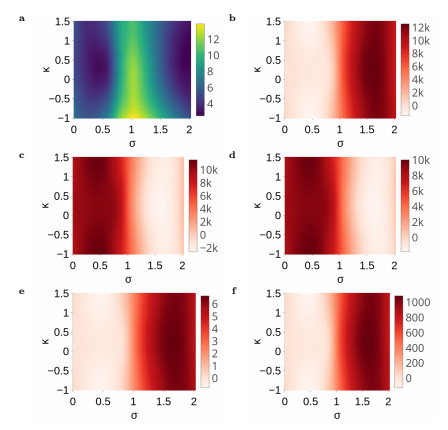
The Metrics
Polarisation
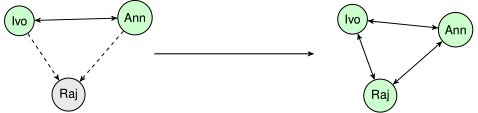
People tend to influence each other, but to also establish friendships with people similar to them (called assortative mixing). So, we can quantify the connections between the parents by looking at
- Communities: densely connected groups of parents that share the same vaccine stance,
- Echo Chambers: groups of parents that share the same vaccination stance and do not communicate with parents that don't agree with them (like a community, but more hardcore),
- Degree of Clustering: to what extend does peer pressure determine a parent's decisions?
- Modularity: a measurement of how segmented the social network is.
Spatial Autocorrelation
Picture this... Your daughter is in a class with a bunch of other children. Say a parent-teacher conference is called; now all the parents in this class are together. Remember that your vaccine stance is influenced by the number of sick friends your daughter is around on a day-to-day basis, so every parent in that class has a common factor to consider.This can be quantified by spatial autocorrelation: Are people who find themselves together more likely to agree than not? Some tools are:
- Join Counts: the number of pro-vaxxers communicating with anti-vaxxers; similarly pro-vaxx/pro-vaxx and anti-vaxx/anti-vaxx links,
- Moran's I: densely connected groups of parents that share the same vaccine stance,
- Geary's C: groups of parents that share the same vaccination stance and do not communicate with parents that don't agree with them (like a community, but more hardcore),
- Probability of having an infected friend: exactly what it says on the tin.
Synchronisation
There's a bit of theory that suggests that, as we move towards an epidemic (critical transition), then the opinion dynamics and physical infection will synchronize, so that a parent's opinion will become more strongly correlated to whether or not their child is ill as an epidemic approaches...I can't find an intuitive explanation right now, but trust me (I'm a professional). Basically, if we kept calculating the probabilities mentioned in these questions
Similarly, what's the probability of an ill child having anti-vaxx parents?
they'd increase as we got closer and closer to a big change. We quantify this with two statistics:
- Correlation Coefficients: the strength of the relationship between two processes,
- Mutual Information: a measurement of the shared information between two dynamics (i.e., How much can I find out about Y by watching X? ).
The Framework
Change Point Statistics
A change point occurs when the probability distribution of the series changes; this can usually be seen by looking at the time series (called eyeballing, though I have proposed the more sciencey-sounding term visual heuristic analysis).
There are a couple tools on offer here, and we use a few in the studies
Test Until 0.05
Here's the catch: we have to be fast. A child is vaccinated as soon as their parent becomes pro-vaccine, but their parent
can change their mind after the fact (within a single time step in the simulation). So, we have to keep monitoring the social network to track changes in "real time". We tested a few ways to do this, and we found that the best viable method was:
- each time step, take the number of agents in each state (i.e., tally all the pro-/anti-vaxxers, infected/recovered children, etc),
- with each now point in the time series, recalculate each change point statistic,
- when any test gives a change point significant at the 5% level, issue a warning,
- let the simulations continue until the transition occurs in the dynamic,
- profit.
Lead Time Metric
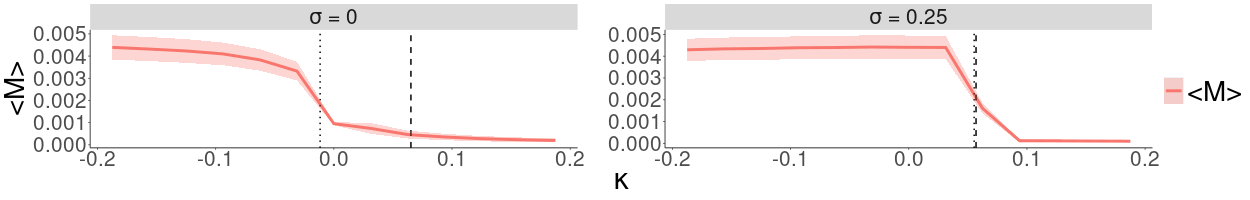
In the diagram above, we can see that there is a change in M before the vertical line (so it's a valid prediction), but a good question is “how far?”. To farm the process out completely to a computer, and to compare the effectiveness of change point detection tests, we calculate
the number of steps between the prediction and the actual event. Called it “lead time”. Nothing fancy, gets the job done.
Sampling Penalty
The third study in the series tested the resilience of the Early Warning Signals (EWS) to changes in social network structure and sampling; the previous tests assumed that it was possible to process the entire parent network, but that assumption is untenable with modern social networks. So, we calculated the EWS lead times for the entire parent network, then compared them to the EWS lead times we got when we randomly sampled 40%, 60% and 80% of the parents.
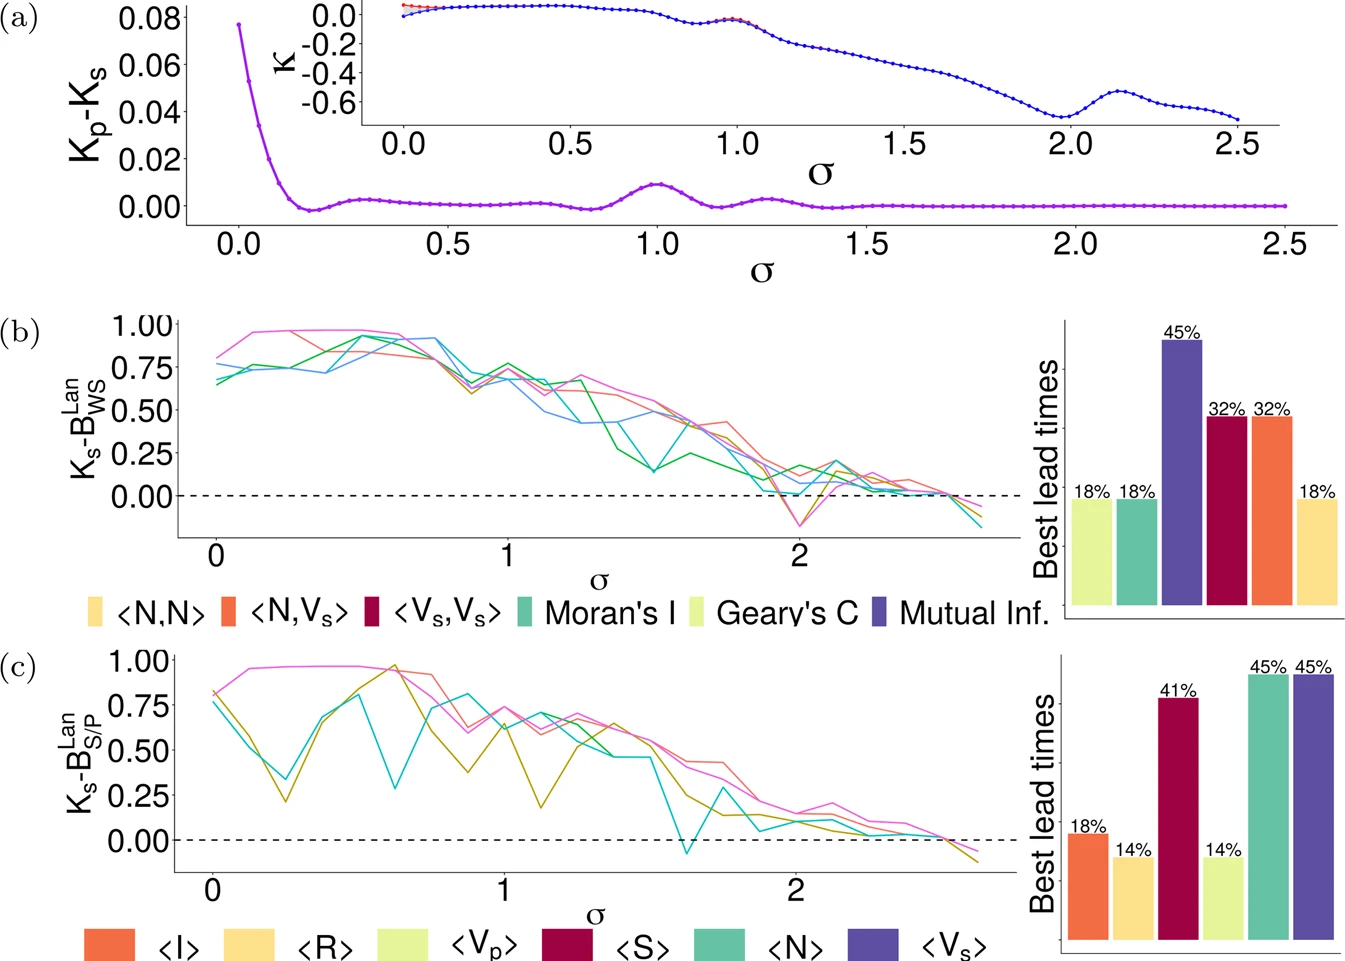
Study 1
Findings:- Mutual Information and Join Count statistics are valid early warning signals,
- All change point detection tests perform similarly, with no grounds for a preference in region of the parameter space,
- Moran's I and Geary's C are linear combinations of different Join Count statistics (formal proof given).
Study 2
Findings:- Numbers, Sizes and location of Communities and Echo Chambers (as defined in the study) are warning signals,
- Network Modularity is a good and Global Clustering Coefficient are good warning signals.
Study 3
Findings:- Triadic Closure and Graph diameter are viable EWS,
- the EWS retain their effectiveness when the parent network is altered,
- the EWS are resilient to sampling,